The chat panel nobody opened was costing us 400MB

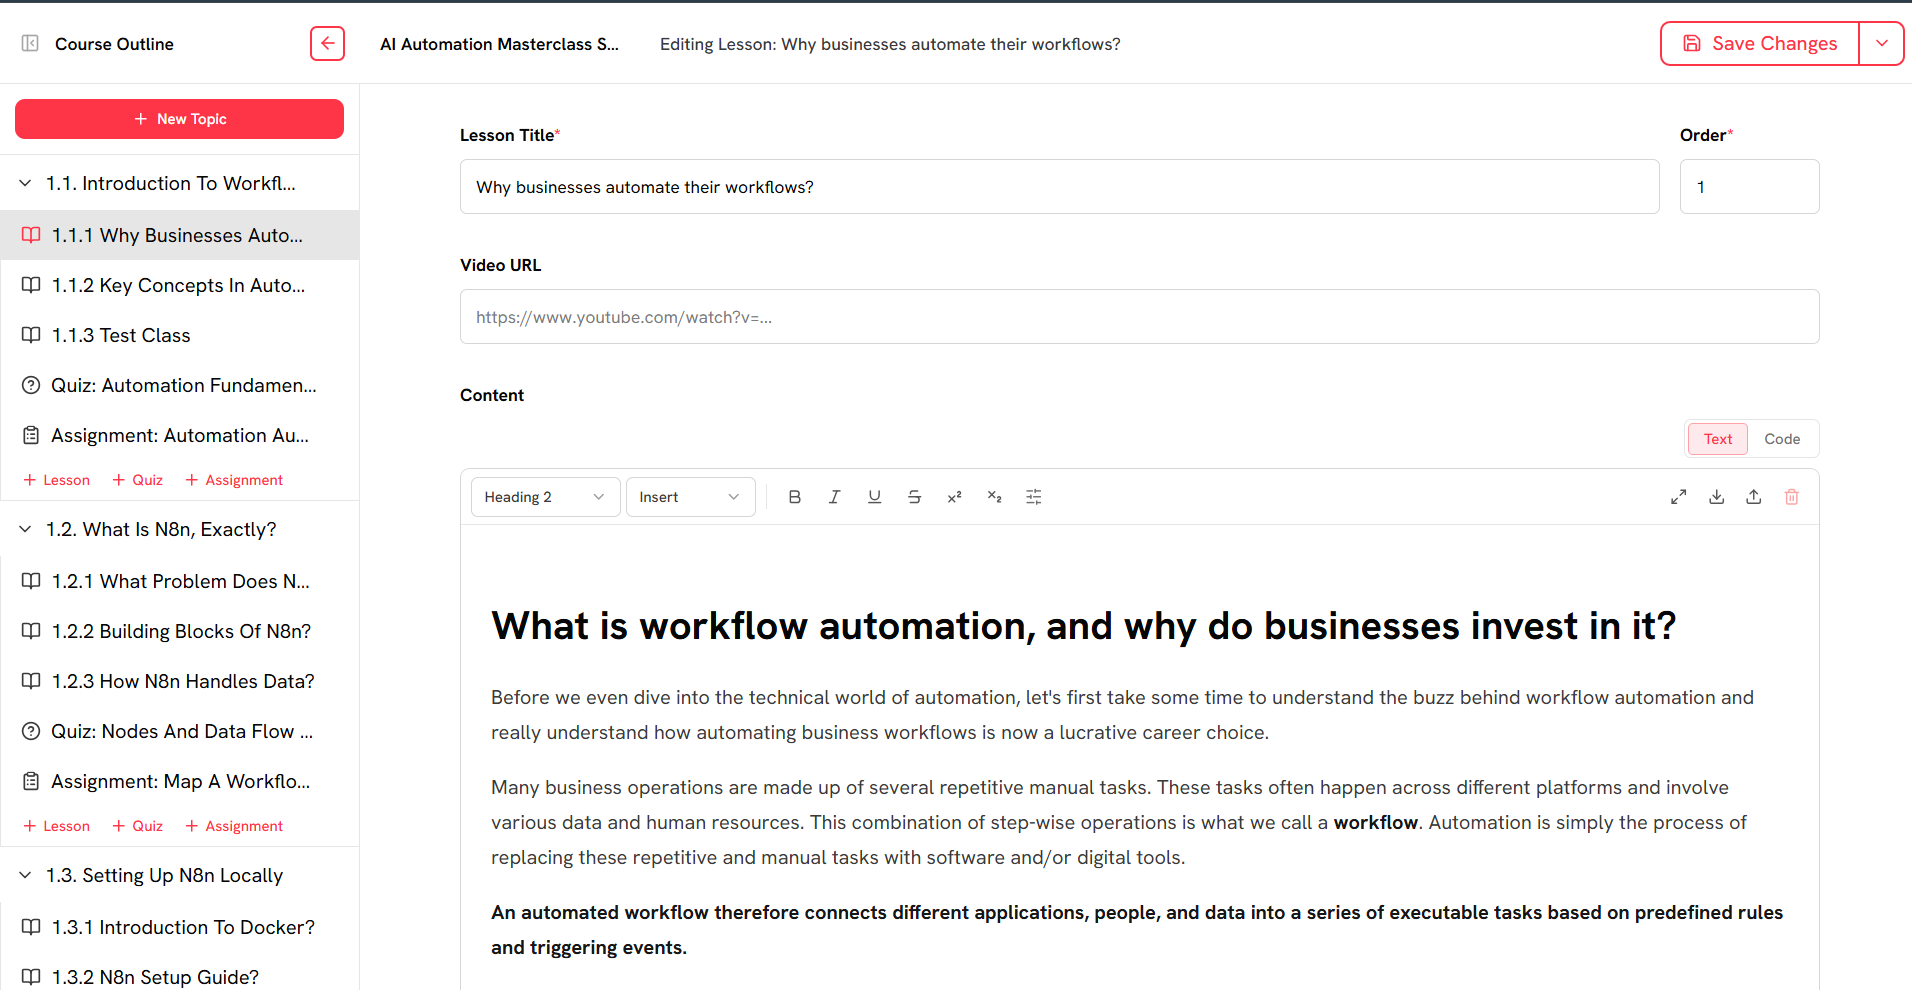
The lesson editor is where an instructor writes a lesson: a rich text editor for the body, a place for a video link, file attachments, and a preview showing what a student will see. Instructors spend hours in it. It is, more than anything else we ship, the thing our customers actually work in.
And for a few months, it had been getting worse.
This first appeared on Medium, in the first person, and it is kept that way here. The code screenshots in the original are real code blocks in this version so you can copy them. Read the original.
What we're building
I work at Rukia Labs, a learning platform for organizations that train people. Coding schools, bootcamps, and company L&D teams. Each customer gets their own branded space: students take courses there, instructors write and publish the material, and admins run the whole thing.
Under the hood that's four separate React applications sharing one component library. A student app, an instructor console, an admin console, and a platform console for us. They live in one repository, so a button looks the same everywhere, and they're deployed to Cloudflare Pages.
The symptom
Authors would open the editor, start writing, and watch the browser tab climb past 400MB of memory. Then keystrokes would start arriving late. Then the page would stop responding altogether. Students got a milder version of the same thing on the lesson page.
The bug reports were the kind you can't act on. "It hangs." "It's heavy today." "I lost a paragraph." Nobody could reproduce it on demand, because it wasn't a crash. It was a slide.
I want to write up what we found, partly because the main cause is something I've never seen flagged in a code review, and partly because my first diagnosis was confidently wrong in a way that cost me an afternoon.
A note for readers who don't build web apps for a living: I've kept the jargon to a minimum and explained the rest as it comes up. If you know what a bundle is, skim the indented notes. If you don't, they're the whole story.
Bundle, chunk, build output. Browsers can't run a folder of a thousand source files efficiently, so before we ship, a tool called a bundler stitches them into a handful of larger files. Each of those files is a chunk. The collection is the bundle. Modern bundlers are clever enough to split it up so a page only downloads the chunks it needs, which is called code splitting. Remember that phrase. It's where this goes wrong.
Starting in the wrong place
The first thing I did was look at the built output of the admin app, sorted by size.
1220K  MarkdownRenderer-8084fe48.js
 772K  MarkdownEditor-49c46f2f.js
 764K  emacs-lisp-93221a04.js
 612K  cpp-ccf25956.js
 608K  wasm-cd10bedf.js
 544K  mermaid.core-90442b6d.js
 436K  cytoscape.esm-b0e8ddfb.js
 260K  wolfram-e51de66a.js
460 chunks, 18MB total. Somewhere in there, our learning platform was shipping syntax-highlighting rules for Cobol, Fortran, and Wolfram Language, which I think we can agree nobody was asking for.
Syntax highlighting is the colouring you see in code snippets: keywords one colour, strings another. To do it, a library needs a grammar for each language: a big set of rules describing what Python looks like, what Rust looks like, and so on. There are hundreds of languages, so there are hundreds of grammars, and each one has real weight.
So I assumed the big renderer chunk and the pile of language chunks were the same problem. One syntax highlighter, configured badly, easy fix.
That was wrong.
There were two syntax highlighters. Not one misconfigured highlighter. Two entirely separate ones that didn't know about each other.
Our markdown renderer used Prism, through a package called
react-syntax-highlighter. Our AI chat components used Shiki. They'd been added
about two years apart, by different people solving different problems, and
neither had any reason to notice the other existed. If you only look at the list
of chunk names, two tidy highlighters and one messy one produce output that
looks the same.
The Prism side was the worse of the two because of how that library's default entry point behaves.
import { Prism as SyntaxHighlighter } from 'react-syntax-highlighter';
That single import pulls in refractor/all, which registers around 237 grammars
into memory the moment the file is loaded. Not lazily. Not on first use. A
lesson made entirely of prose, with no code in it at all, paid for every one of
them.
The Shiki side was the full bundle: roughly 290 languages and 60 themes, each
emitted as its own chunk. Hence, emacs-lisp at 764K, sitting in a build for a
school that teaches Python and JavaScript.
The part I hadn't seen before
Here's the code that actually mattered. I'll show it the way it appeared in the file, because I don't think most people would look twice at it.
import InstructorChatPanel from "@/pages/course-master/components/InstructorChatPanel"

// ... about 600 lines later ...

{!editorFullscreen && showChat && (
  <InstructorChatPanel onClose={() => setShowChat(false)} />
)}
showChat starts as false. Most authors never open the chat at all. The render
is conditional and correct, and it had been through code review more than once.
But InstructorChatPanel imports a message component, which imports a library
called streamdown, whose own dependencies include Mermaid (for diagrams),
Shiki (highlighter number two), KaTeX (for maths), and a stack of markdown
plugins. Mermaid in turn brings in a graph-layout library and a separate chunk
per diagram type.
None of that is gated by showChat.
Static versus dynamic imports. A normal
import X from "..."at the top of a file is a static import. The bundler treats it as "this file needs that file, always", and follows the chain outwards: what does that file need, and what does that one need. The result is a graph, and everything in it ships and runs when the page loads.A dynamic import, written
import("..."), is a promise. It says "fetch this later, if I ask". That's the one the bundler is allowed to split off into a chunk that only downloads on demand.The conditional
{showChat && <Panel />}happens far later, at render time, and only decides whether React puts an element on screen. By then every module in that graph has already been fetched, parsed and executed.
Opening the lesson editor was downloading and running roughly 1.9MB of source for a panel that stayed shut.
The bit that actually stung was finding this in our own student app, in a different file, written months earlier:
// Lazy, and deliberately so. FloatingChatWidget pulls in ChatPage, which pulls
// MarkdownRenderer (katex + react-syntax-highlighter -> refractor) and
// ai-elements' streamdown - around 1.9MB of source that ended up in the ENTRY
// chunk... None of it is needed to paint a dashboard, and most visitors never
// open the chat at all.
const FloatingChatWidget = lazy(() => import('@/pages/ChatPage/FloatingChatWidget'));
Someone had already worked this out. Same libraries, same 1.9MB, and they'd left a clear note explaining exactly why the lazy wrapper was there.
Then we built the lesson routes and reintroduced the identical problem in three more places.
A comment only reaches the person already reading that file. It has no way of stopping the next person doing the same thing somewhere else. Hold that thought, because it's where this ends up.
Why it got worse as you typed
Bundle weight explains a slow page load. It doesn't explain a page that's fine for ten minutes and then isn't. That turned out to be somewhere else entirely.
export const queryClient = new QueryClient({
  defaultOptions: {
    queries: {
      staleTime: 30 * 1000,
      gcTime: 24 * 60 * 60 * 1000,   // 24 hours
    },
  },
})

const persister = createSyncStoragePersister({
  storage: window.localStorage,
  throttleTime: 1000,
})

persistQueryClient({ queryClient, persister, maxAge: 24 * 60 * 60 * 1000 })
Every line of this is reasonable on its own.
What this code does. We use a library that caches data fetched from our API, so moving between pages doesn't refetch everything.
gcTimeis how long an unused cache entry sticks around: 24 hours here, so coming back to a page tomorrow paints instantly instead of showing a spinner.persistQueryClientwrites that cache into the browser'slocalStorage, so even a full page reload doesn't lose it.throttleTime: 1000limits those writes to at most one a second, which sounds like the safety rail.
Put the three together on a page that holds course content, and you get something else.
Writing to localStorage means converting the entire cache into a single text
string first, using JSON.stringify. That happens on the main thread,
which is the one thread the browser also uses to respond to your keyboard. And
it happens whenever anything in the cache changes, up to once a second.
There was no filter on what got persisted, so "the entire cache" meant every course outline we'd loaded, and each of those carried its topics with all their lessons, quizzes, and assignments expanded inline.
Now follow an edit through. The author saves. The save succeeds. The app marks
the course data stale and refetches it. The cache updates. The whole thing gets
converted to a string again while they're partway through the next sentence.
With gcTime at 24 hours, nothing was ever evicted, so every course anyone had
opened that shift was still in there, being stringified along with it.
There's a second failure hiding inside the first. localStorage tops out at
around 5MB. Go past it and the write throws an error, and a cache that can't be
written is a cache that restores nothing. You don't get a red message in the
console. You get a feature that quietly stopped doing the job it was added for,
with no signal that anything changed.
The ordinary React mistakes
The rest was nothing clever. Just normal patterns at a size where normal stops working.
Two full serializations of the document, on every render, to work out one true-or-false question:
const isDirty =
  lessonDraft && JSON.stringify(lessonDraft) !== JSON.stringify(originalDraft)
This asks, "Has the author changed anything?" by converting the entire lesson to a string twice and comparing. It sits at the top of the component with no caching, so it runs on every single render. On a 200 KB lesson at typing speed, that's megabytes a second of throwaway text.
Comparing the fields one by one answers the same question almost for free, because an unedited body is literally the same object in memory on both sides. The computer can check that with a single pointer comparison instead of reading 200,000 characters twice.
Then this one, which I think is the most common version of this mistake:
const components = buildComponents(theme); // 26 fresh closures, every render
Why a "new object every time" is expensive. React skips re-rendering a component when its inputs haven't changed, and it decides that by checking whether the inputs are the same object, not whether they look the same. Build a fresh object on every render and React can never take the shortcut.
react-markdown compares this prop by identity. Handing it a new object each
time meant the entire markdown document re-rendered, and every code block got
re-highlighted whenever anything on the page changed. Caching that one object
was a single line and probably the best return of the whole exercise.
An entire second editor, mounted permanently and hidden with CSS:
<div className={cn("absolute inset-0", isSourceMode ? "opacity-100" : "opacity-0")}>
  <Editor /* Monaco */ options={{ automaticLayout: true }} />
</div>
Our editor has two modes: a rich text view and a raw markdown view. The raw view uses Monaco, the same editor that powers VS Code. It was never unmounted. It was just made invisible.
So every markdown editor on the page carried a live Monaco instance, its document model, its tokenizer, and a resize observer, sitting alongside the rich text editor; in the default mode most sessions never leave. Our quiz question form mounts two editors, so it was doing all of that twice.
opacity-0 doesn't unmount anything. Neither does display: none, or
pushing something off-screen with a transform. If the hidden thing owns an
editor, a video player, or a map, it is fully alive and fully costing you.
And one that scaled badly: the quiz review screen renders two markdown blocks per question, and each one, if you don't tell it which theme to use, sets up its own watcher on the page to detect dark mode. Forty questions meant eighty watchers on the same element. Toggling dark mode fired eighty updates, each re-parsing and re-highlighting a full document inside a single frame.
The number we should have been tracking
Total bundle size caught none of this. It's 18MB before and 18MB after, because code splitting means most of it is never fetched. The number tells you nothing about what any given page actually costs.
What you want is the static closure of a route: start at the chunk for one page, follow only the static imports, and add up the bytes. That's what the browser really downloads and runs before that page becomes usable. Dynamic imports are excluded on purpose, because deferring them is the entire point of them.
It's about twenty lines of Node.
const fs = require('fs'), path = require('path');
const [dir, entryPattern] = process.argv.slice(2);

const entry = fs.readdirSync(dir)
  .find(f => f.startsWith(entryPattern) && f.endsWith('.js'));

const seen = new Set();
const stack = [entry];
let total = 0;

while (stack.length) {
  const file = stack.pop();
  if (seen.has(file)) continue;
  seen.add(file);

  const full = path.join(dir, file);
  if (!fs.existsSync(full)) continue;
  total += fs.statSync(full).size;

  const src = fs.readFileSync(full, 'utf8');
  // Static edges only: `from"./x.js"` and `import"./x.js"`.
  // Not `import("./x.js")`, since a dynamic import is exactly what we want to skip.
  for (const m of src.matchAll(/(?:from|import)"\.\/([^"]+\.js)"/g)) {
    stack.push(m[1]);
  }
}

console.log(`${entryPattern}: ${seen.size} chunks, ${(total / 1048576).toFixed(2)} MB`);
Point it at your build output and a page's chunk name. The pattern-matching in it assumes Rollup or Vite output, so adjust that line for other bundlers.
The variant I've found more useful doesn't measure anything at all. It just asks whether a given library is reachable from a given page by filtering the list of visited files instead of adding up their sizes.
LessonExperiencePage closure matching /mermaid|cytoscape|refractor/: NONE
That line is an assertion. Put it in your continuous integration, and "somebody statically imported the chat panel again" becomes a failing build instead of a support ticket eight months later. Unlike a size budget, there's no threshold to argue about. It's true or it's false.
Where we ended up
markdown renderer chunk      1220K              ->  704K
student lesson route         3.4MB / 38 chunks  ->  2.50MB / 24 chunks
admin lesson editor route    not measured       ->  2.60MB / 39 chunks
Mermaid, the graph library, and the 237 Prism grammars are no longer reachable from any of the three lesson pages, which is the result I actually care about.
The heavy chunks still exist in the build. They're only reachable from the
lazily loaded chat now, because streamdown bundles its own copy of Shiki, and
getting rid of that means replacing the library. That's a behavior change, not a
performance fix, so we left it alone.
I think that distinction is worth holding onto. We weren't trying to make the build folder smaller. We were trying to stop a page paying for things it doesn't use. Those are different goals that happen to overlap sometimes, and confusing them leads you to optimize the wrong number.
I'm Manasseh, and I am part of the team building Rukia Labs. If you're running training programs and fighting your tooling instead of teaching, come say hello.